Public Health Facilities in Carmona

1 Main Health Center- located in Brgy.2, offers new born screening, diagnostic & laboratory services & specialty clinic.
12 Barangay Health Stations- located in each Barangays, carry out the health programs of MHO from child care to safe motherhood. It is also the center for dissemination of health information and campaigns.
1 Pagamutang Bayan ng Carmona-located in Brgy.2 beside the Municipal Town Plaza, operates on a 24 hour basis, manned by 47 medical personnel, offers OPD, ER, OB, Medico Legal, Admission, DM, Diagnostics & Laboratory services & specialty clinic. As of 2017 until now, the Pagamutang Bayan ng Carmona is under renovation.
1 Water Laboratory- performs water tests requested by residents to determine the quality of water in their respective locations.
1 Smoke Cessation Clinic- offers counseling & medication services to residents to aid them end their smoking habits.
1 PT/ OT Clinic- perform hands-on work to help rehabilitate our people with their injuries or disabilities.
List of Public Health Facilities, 2019
Facility Name | Address and Street Name | Barangay location | Type of Facility | |
1 | Carmona RHU | J.M. Loyola Street | Barangay 4 | RHU |
2 | Poblacion I BHS | San Pablo Street | Barangay 1 | BHS |
3 | Brgy. 8 BHS | Konsehales Street | Barangay 8 | BHS |
4 | Maduya BHS | Altarez | Barangay Maduya | BHS |
5 | Cabilang Baybay BHS | Barangay Hall Compound | Barangay Cabilang Baybay | BHS |
6 | Mabuhay BHS | Hebron Street | Barangay Mabuhay | BHS |
7 | Milagrosa BHS | Purok 3 | Barangay Milagrosa | BHS |
8 | Phase III BHS | Blk. 19 Phase 3 | Barangay Milagrosa | BHS |
9 | Phase IV BHS | Bonifacio Street | Barangay Milagrosa | BHS |
10 | Lantic BHS | Alfonso Macha Street | Barangay Lantic | BHS |
11 | Carmona Estate BHS | Carmona Estate | Barangay Lantic | BHS |
11 | Paligawan BHS | Paligawang Matanda | Barangay Lantic | BHS |
12 | Bancal BHS | Abandoned Road | Barangay Bancal | BHS |
13 | Pagamutang Bayan ng Carmona | San Jose Street | Barangay 2 | HOSPITAL |

The Municipality has thirteen (13) Barangay Health Stations (BHS) that serve its residential jurisdictions. Three of which are established at Barangay Milagrosa, which is the most populated area in the municipality. Medical services were also extended to distant sitio like Paligawan in Barangay Lantic. With the chart shown above, additional midwives and Barangay Health Stations (BHS) are necessary to be able to meet the arduous needs of the growing population every year.
Table 1: Medical Facilities and Personnel, 2019
FACILITIES | NO. OF PERSONNEL | ||||||||||
BARANGAY | Type | No. of Beds | Physical Condition (Good or For Repair) | Doctors | Nurses | Midwives | Sanitary Inspectors/Engineer | BHW | FHW | Others | Total |
Brgy 1 | BHS | 1 | Good | 1 | 3 | 16 | 20 | ||||
Brgy 2 | Hospital | 25 | Good | 13 | 19 | 5 | 37 | ||||
PT/OT Clinic | 5 | Good | 1 | PT-1 | 2 | ||||||
Brgy 4 | MAIN RHU | 3 | Good | 9 | 4 | 3 | 2 | 6 | 0 | MT-4 Dentist-2 | 30 |
Brgy 8 | BHS | 1 | Good | 1 | 10 | 14 | 25 | ||||
Brgy 9 | BHS | 4 | Good | 8 | 60 | 68 | |||||
Brgy 10 | BHS | 2 | Good | 9 | 27 | 36 | |||||
Brgy 11 | BHS | 2 | Good | 1 | 9 | 26 | 36 | ||||
Brgy 12 Proper | BHS | 4 | Good | 12 | 88 | 100 | |||||
Brgy 12 – Phase 3 | BHS | 2 | Good | 1 | 3 | 15 | 19 | ||||
Brgy. 12 – Phase 4 | BHS | 1 | Good | 1 | 5 | 17 | 23 | ||||
Lantic Proper | BHS | 6 | Good | 1 | 10 | 20 | 31 | ||||
Lantic – Carmona Estates | BHS | 1 | Good | 1 | 1 | ||||||
Lantic – Paligawan | BHS | 1 | Good | 1 | 3 | 7 | 11 | ||||
Bancal | BHS | 6 | Good | 1 | 13 | 30 | 44 | ||||
TOTAL |
| 23 | 23 | 17 | 2 | 91 | 320 | 7 | 483 | ||
The Municipality of Carmona owns and operates a public hospital, the Pagamutang Bayan ng Carmona (PBC) with 15-bed-capacity, 1 Main Health Center and 13 Barangay Health Stations (BHS). All health facilities are equipped with modern medical/laboratory equipment and medicines/supplies.
The Municipal Health Office and Pagamutang Bayan ng Carmona (PBC) is headed by the Municipal Health Officer with 23 doctors, 23 nurses, 17 midwives, 2 sanitary inspectors, 4 medical technologists, 1 physical therapist, 2 dentists, 91 Barangay Health Workers, and 320 Family Health Workers. The total medical personnel for 2019 are 483.
Medical Personnel from Privates Clinics/Hospital
Table 1-a
Private Medical Personnel | |||
| 2017 | 2018 | 2019 |
Doctors | 151 | 164 | 164 |
Nurses | 96 | 102 | 102 |
Midwives | 10 | 11 | 11 |
Total: | 257 | 277 | 277 |
Number of Private Hospital and Clinic
Table 1-b
Health Facilities | 2017 | 2018 | 2019 |
Private Clinic | 44 | 44 | 44 |
Private Clinic Beds | 67 | 67 | 67 |
Private Hospital | 1 | 1 | 1 |
Private Hospital Beds | 71 | 71 | 71 |
Private Diagnostic Center | 7 | 7 | 5 |
Private Diagnostic Center Beds | 7 | 7 | 5 |
The table below shows the number of private hospitals and clinics together with the total number of medical personnel for the last three (3) years. To date, the municipality of Carmona has one (1) private hospital and forty-four (44) private clinics attended by two-hundred seventy-seven (277) medical personnel, consisting of 164 doctors, 102 nurses and 11 midwives.
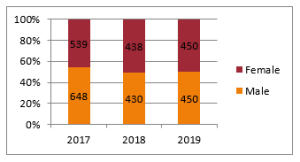
There were 900 live births registered in 2019. This figure is higher by 32 or 3.69% of live births from the previous year.
Table 2: Live births by Sex, by Barangay, 2017-2019
| 2018 | ||||||||
BARANGAY | 2017 | 2019 | |||||||
M | F | T | M | F | TOTAL | M | F | TOTAL | |
Barangay I-3 | 23 | 16 | 39 | 215 | 216 | 431 | 219 | 216 | 435 |
Barangay 4-7 | 5 | 4 | 9 | 1 | 1 | 2 | 2 | 0 | 2 |
Barangay 8 | 9 | 12 | 21 | 0 | 0 | 0 | 0 | 0 | 0 |
Maduya | 35 | 19 | 54 | 7 | 6 | 13 | 2 | 3 | 5 |
Cabilang Baybay | 43 | 53 | 96 | 11 | 13 | 24 | 5 | 5 | 10 |
Mabuhay | 64 | 60 | 124 | 125 | 138 | 263 | 145 | 153 | 298 |
Milagrosa | 186 | 149 | 335 | 53 | 44 | 97 | 68 | 66 | 134 |
Barangay Lantic | 112 | 114 | 226 | 9 | 12 | 21 | 0 | 2 | 2 |
Barangay Bancal | 171 | 112 | 283 | 9 | 8 | 17 | 9 | 5 | 14 |
TOTAL | 648 | 539 | 1187 | 430 | 438 | 868 | 450 | 450 | 900 |
Normal and Operative Deliveries by Place, 2019
In 2019, a total of eight hundred fifty-eight (858) birth deliveries recorded, of which the highest composition (50%) is the 428 babies born at Hospitals, followed by the 337 (39%) babies born at Lying-in Clinics, while the remaining birth deliveries reportedly came from identified barangay health stations (11%).

Table 3: Nutritional Status of Children by Barangay Health Station, 2019
OPT RESULT 2019 WEIGHT -FOR LENGTH -FOR –HEIGHT
BARANGAY | NORMAL | OVER WEIGHT | OBESE | WASTED | SEVERELY WASTED |
|
|
| |||
|
|
| |||
BARANGAY 1 | 289 | 6 | 10 | 7 | 0 |
BARANGAY 2 | 65 | 4 | 9 | 1 | 0 |
BARANGAY 3 | 18 | 0 | 2 | 0 | 0 |
BARANGAY 4 | 46 | 3 | 2 | 0 | 0 |
BARANGAY 5 | 36 | 3 | 1 | 0 | 0 |
BARANGAY 6 | 49 | 2 | 0 | 0 | 0 |
BARANGAY 7 | 44 | 0 | 0 | 0 | 0 |
BARANGAY 8 | 239 | 20 | 19 | 4 | 2 |
BARANGAY 9 | 490 | 51 | 20 | 17 | 9 |
BRGY. CABILANG BAYBAY | 739 | 34 | 33 | 21 | 3 |
BARANGAY MABUHAY | 399 | 41 | 29 | 24 | 7 |
BARANGAY MILAGROSA | 2275 | 72 | 50 | 54 | 33 |
BARANGAY LANTIC | 1246 | 112 | 89 | 30 | 10 |
BARANGAY BANCAL | 1433 | 109 | 90 | 34 | 18 |
TOTAL | 7368 | 457 | 354 | 192 | 82 |
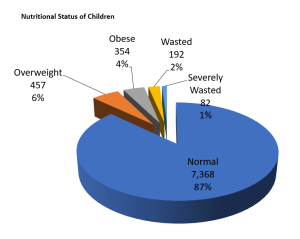
In 2019, 8,453 children are weighed during the Operation Timbang (OPT) conducted by the Municipal Health Office. It shows that 82 (1%) children were undernourished or considered as severely wasted; 7, 368 (87%) children are in normal weight while 457 (6%) were found out to be overweight.
Malnutrition comes in two different forms or groups, one is “under nutrition” while the other one is “overweight”. Wasting type of malnutrition falls on the undernutrition category, and based on the data, there are 192 (2%) wasted children, while 354 (4%) were obese. Most of the severely wasted children are from Barangay Milagrosa, while most of the overweight and obese children came from Barangay Lantic and Bancal.
Number of Malnourished Children for the Last 6 Years, 2014-2019
Table 4
BARANGAY | 2014 | 2015 | 2016 | 2017 | 2018 | 2019 |
Barangay 1-3 | 25 | 22 | 17 | 18 | 8 | 8 |
Barangay 4-7 | 4 | 10 | 0 | 0 | 0 | 0 |
Barangay. 8 –Rosario | 9 | 7 | 17 | 14 | 4 | 6 |
Maduya | 21 | 39 | 24 | 25 | 17 | 26 |
Cabilang Baybay | 37 | 30 | 28 | 28 | 21 | 24 |
Mabuhay | 39 | 42 | 41 | 37 | 24 | 31 |
Milagrosa | 157 | 115 | 104 | 91 | 54 | 87 |
Lantic | 29 | 30 | 61 | 38 | 30 | 40 |
Bancal | 32 | 41 | 27 | 17 | 34 | 52 |
TOTAL | 353 | 336 | 319 | 268 | 192 | 274 |
A total of 274 children were reportedly malnourished in 2019. This is higher by 42.71% or an increase of 82 cases from the previous record of 192 malnourished children. Among 14 barangays, Milagrosa has the highest number with 87 severely wasted children, followed by Barangay Bancal with 52 children, while Barangay 4-7 has no record of malnourished children.
Data also shows that for the last six years, 2018 projected the least number of malnourished children in the municipality with a total of 192 individuals.
Table 5. Crude Birth Rate, 2019
AREA | POPULATION | NO. OF BIRTH | TOTAL | RATE | |
MALE | FEMALE | Per 1,000 popn | |||
Bancal | 16846 | 9 | 5 | 14 | 0.08 |
Barangay 1 (Pob) | 3845 | 1 | 2 | 3 | 0.08 |
Barangay 2 (Pob) | 817 | 218 | 214 | 432 | 52.88 |
Barangay 3 (Pob) | 984 | 0 | 0 | 0 | 0 |
Barangay 4 (Pob) | 753 | 0 | 0 | 0 | 0 |
Barangay 5 (Pob) | 681 | 2 | 0 | 2 | 0.29 |
Barangay 6 (Pob) | 908 | 0 | 0 | 0 | 0 |
Barangay 7 (Pob) | 841 | 0 | 0 | 0 | 0 |
Barangay 8 (Pob) | 3402 | 0 | 0 | 0 | 0 |
Cabilang Baybay | 9201 | 5 | 5 | 10 | 0.11 |
Lantic | 22156 | 0 | 2 | 2 | 0.01 |
Mabuhay | 11493 | 145 | 153 | 298 | 2.59 |
Maduya | 12360 | 2 | 3 | 5 | 0.04 |
Milagrosa | 26777 | 68 | 66 | 134 | 0.5 |
Total | 111,064 | 450 | 450 | 900 | 0.81 |
The crude birth rate for 2019 is 0.81 per 1,000 populations, which is relatively lower than the previous year’s 8.73. Barangay 2 has the highest number of recorded deliveries with 432, followed by Barangay Mabuhay with 298. The observed trend is due to the availability of the Pagamutang Bayan ng Carmona (PBC), the only public hospital in the municipality, strategically located at Barangay 2.
Table 6. Crude Death Rate, 2018 & 2019
BARANGAY | POPULATION | 2018 NO. OF DEATH | RATE | 2019 NO. OF DEATH | RATE |
Bancal | 16846 | 27 | 1.87 | 34 | 2.02 |
Barangay 1 (Pob) | 3845 | 12 | 3.38 | 10 | 2.6 |
Barangay 2 (Pob) | 817 | 89 | 98.13 | 112 | 137.09 |
Barangay 3 (Pob) | 984 | 4 | 3.82 | 2 | 2.03 |
Barangay 4 (Pob) | 753 | 3 | 4.22 | 2 | 2.66 |
Barangay 5 (Pob) | 681 | 0 | 0.00 | 3 | 4.41 |
Barangay 6 (Pob) | 908 | 0 | 0.00 | 2 | 2.2 |
Barangay 7 (Pob) | 841 | 3 | 3.33 | 4 | 4.76 |
Barangay 8 (Pob) | 3402 | 9 | 2.39 | 7 | 2.06 |
Cabilang Baybay | 9201 | 17 | 2.02 | 22 | 2.39 |
Lantic | 22156 | 46 | 4.25 | 32 | 1.44 |
Mabuhay | 11493 | 29 | 2.37 | 35 | 3.05 |
Maduya | 12360 | 21 | 1.81 | 33 | 2.67 |
Milagrosa | 26777 | 46 | 1.56 | 54 | 2.02 |
Total | 111,064 | 306 | 3.08 | 352 | 3.17 |
The crude death rate for 2019 is 3.17 per 1,000 populations, which is higher than the previous record of 3.08. The highest number of death was recorded at Barangay 2 (Poblacion), followed by Barangay Milagrosa. Meanwhile, Barangays 3-8 (Poblacion) got the least number of deaths this year.
Table 7: Crude Birth Rate and Crude Death Rate for the Last 5 Years, 2015-2019
YEAR | CRUDE BIRTH RATE (CBR) | % INCREASE/ DECREASE | CRUDE DEATH RATE (CDR) | % INCREASE/ DECREASE |
2015 | 15.91 | 3.3 | ||
2016 | 8.4 | -0.0751 | 3.7 | -0.004 |
2017 | 9.19 | 0.0079 | 3.66 | -0.0004 |
2018 | 8.73 | -0.0046 | 3.08 | 0.0058 |
2019 | 0.81 | -0.0792 | 3.17 | 0.0009 |
In 2019, the crude birth rate was significantly reduced to 0.81%, while the crude death rate increased to 3.17%. The leading cause of Mortality this year is the Acute Myocardial Infarction with 87 cases, while the leading cause of Morbidity is Acute Upper Respiratory Infection with 11,913 cases. These two (2) leading causes of Mortality and Morbidity have increased as compared in the previous year’s data.
Crude Birth Rate 0.81% or 900 births (2019)
Crude Death Rate 3.17% or 352 deaths (2019)
No. Of Birth | Neonatal Mortality | Infant Mortality | Young Child Mortality |
900 | 3 | 6 | 8 |
Rate/1000 Population | 0.3 | 0.7 | 0.9 |
Table 8. Top Ten Leading causes of Morbidity 2019
CAUSE | CASES | RATE |
1. Acute Upper Respiratory Infection | 11913 | 10.73 |
2. Urinary Tract Infection | 2572 | 2.31 |
3. Pneumonia | 1659 | 1.49 |
4. Hypertension | 1482 | 1.33 |
5. Systemic Viral Infection | 1474 | 1.32 |
6. Muscle Strain | 1295 | 1.17 |
7. Dengue | 1133 | 1.02 |
8. Gastritis | 716 | 0.63 |
9. Infected Wound | 667 | 0.6 |
10. Age | 640 | 0.57 |
Over the past years, acute upper respiratory infection is the leading cause of morbidity in the municipality. In 2019, 10.73% or 11, 913 cases were reported to the Municipal Health Office. This is 5.40% higher than the previous year’s record of 11,303 reported incidents.
The morbidity or the condition of being ill, diseased or unhealthy of the people points out the following enumerated infections with the urinary tract infection as the second cause of morbidity. Dengue and aging of the people have entered the list, comprising 1.02% and 0.57% of the total number of deaths, respectively.
Table 9. Top Ten Leading Causes of Mortality, 2019
CAUSE | CASE | RATE |
1. Acute Myocardial Infarction | 87 | 0.78 |
2. Pneumonia | 50 | 0.45 |
3. Electrolyte Imbalance | 40 | 0.36 |
4. Cancer | 39 | 0.35 |
5. CVA | 28 | 0.25 |
6. Renal Failure | 26 | 0.23 |
7. Infarct | 18 | 0.16 |
8. Vehicular Accident | 18 | 0.16 |
9. COPD | 16 | 0.14 |
10. Septicaemia | 7 | 0.06 |
Acute Myocardial Infarction, which is the medical name for Heart Attack is the leading cause of Mortality in the country. It is also the primary cause of death by some people in the municipality of Carmona. As of 2019, 87 deaths were reported due to this case and recorded a 27.94% increase from last year’s record of 68 deaths. Pneumonia and Electrolyte Imbalance followed with 50 and 40 cases, respectively. Chronic obstructive pulmonary disease (COPD), also known as lung disease has entered the list this year, along with the vehicular accidents.
Table 10: General Health Situation for the Last 5 Years, 2015-2019
The overwhelming drive towards better health services resulted in a healthy citizenry as shown on the health indices below:
INDICATORS |
2015 |
2016 |
2017 |
2018 |
2019 |
Natality | |||||
1. Crude Birth Rate | 15.91 | 8.4 | 9.19 | 8.73 | 0.81 |
Mortality | |||||
1. Crude Death Rate | 3.3 | 3.7 | 3.66 | 3.08 | 3.17 |
2. Infant Mortality Rate | 4.1 | 1.11 | 1.12 | 0.7 | 11.11 |
3. Child Mortality Rate | 0.04 | 1.6 | 1.56 | 0.9 | 12.22 |
4. Maternal Mortality Rate | 0 | 0 | 0 | 0 | 0 |
TB Treatment
TB treatment success rate decreased from 99% in 2017 to 96.50% in 2019. Despite its decreased, Carmona is still above the DOH target rate of 90%. Takbo Lung Fun Run, DOT or Directly Observed Treatment, Livelihood Training and Self Employment Assistance of TB patients are the contributing factors to TB Success Rate.
YEAR | CURE RATE |
2014 | 93 % |
2015 | 94 % |
2016 | 95.02 % |
2017 | 99% |
2018 | 94.58% |
2019 | 96.50% |
Table 11. Family Planning – Case Prevalence Rate (CPR), 2018 & 2019
Area | CPR
| |
2018 | 2019 | |
Bancal | 42.94% | 49.23% |
Barangay 1 (Pob.) | 34.93% | 34.60% |
Barangay 2 (Pob.) | 12.50% | 13.86% |
Barangay 3 (Pob.) | 20.93% | 18.18% |
Barangay 4 (Pob.) | 94.32% | 90.32% |
Barangay 5 (Pob.) | 28.24% | 30.95% |
Barangay 6 (Pob.) | 40.52% | 31.25% |
Barangay 7 (Pob.) | 18.92% | 10.58% |
Barangay 8 (Pob.) | 40.09% | 44.63% |
Cabilang Baybay | 38.77% | 38.18% |
Lantic | 65.09% | 37.64% |
Mabuhay | 41.51% | 43.19% |
Maduya | 26.42% | 23.24% |
Milagrosa | 49.05% | 53.27% |
TOTAL | 43.82% | 42% |
The contraceptive prevalence rate (CPR) or the proportion of married women age 15-49 years old reported to be of current use or dependent of contraceptives decreased to 42% in 2019 from the 43.82% record in 2018. However, this is still below the DOH Target for CPR of 65%.
Child Health
Table 12. Percentage of Fully-immunized Children, 2019
BRGY. | Fully-Immunized Children | |||
| Male | Female | Total | Percentage (%) |
Bancal | 147 | 160 | 307 | 67.47% |
Barangay 1 (Pob.) | 26 | 17 | 43 | 41.35% |
Barangay 2 (Pob.) | 1 | 1 | 2 | 9.09% |
Barangay 3 (Pob.) | 2 | 1 | 3 | 11.11% |
Barangay 4 (Pob.) | 0 | 0 | 0 | 0.00% |
Barangay 5 (Pob.) | 0 | 0 | 0 | 0.00% |
Barangay 6 (Pob.) | 5 | 8 | 13 | 52.00% |
Barangay 7 (Pob.) | 0 | 9 | 9 | 39.13% |
Barangay 8 (Pob.) | 31 | 22 | 53 | 57.61% |
Cabilang Baybay | 72 | 78 | 150 | 60.48% |
Lantic | 176 | 168 | 344 | 57.53% |
Mabuhay | 74 | 71 | 145 | 46.77% |
Maduya | 93 | 73 | 166 | 49.70% |
Milagrosa | 225 | 193 | 418 | 57.81% |
TOTAL | 852 | 801 | 1,653 | 55.12% |
FIC RATE | |
2014 | 69.21 % |
2015 | 70.5 % |
2016 | 73 % |
2017 | 72.44 % |
2018 | 58.96% |
2019 | 55.12% |
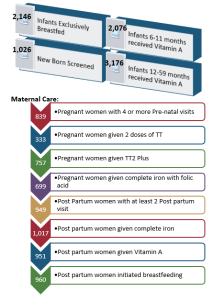
Maternal Care: